
Sheet music its self is graphic in that it uses symbols to communicate to the musician which notes they should play, when and how fast.
However, this is not the only way to communicate pitch, rhythm and tempo.
Some designers and musicians create 'graphic scores' to communicate how the music sounds.
"Can a musician play from art? I do not mean a Mona Lisa Minuet or a Hay Wain Sonata, but the current sheaf of scores that Joanna MacGregor is performing with her ensemble. They look at first glance like pictures from an exhibition rather than pieces for a recital. These are the graphic scores which had their heyday in the musically libertarian 1970s."
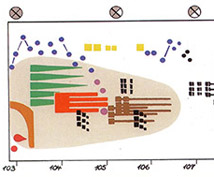
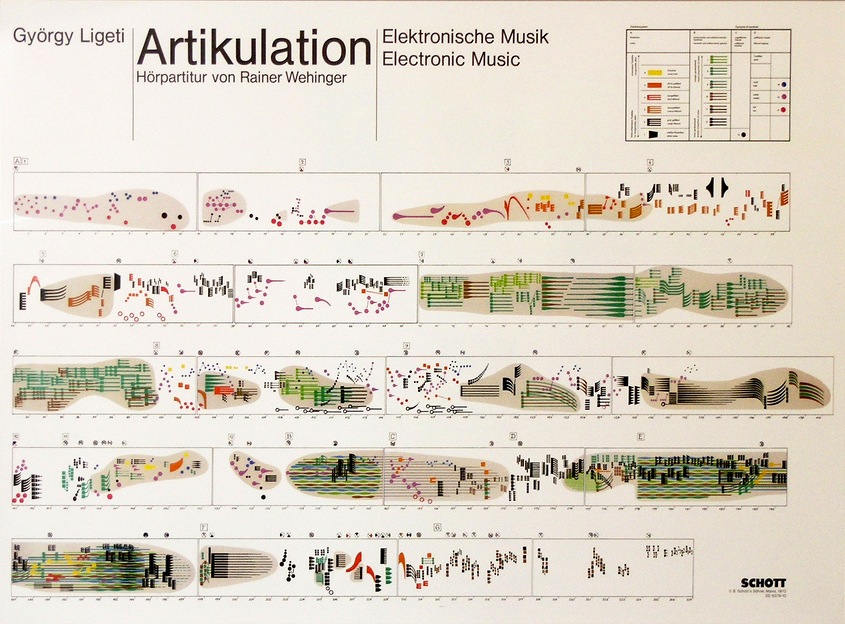
Ligetis' Artikulation by Wehinger
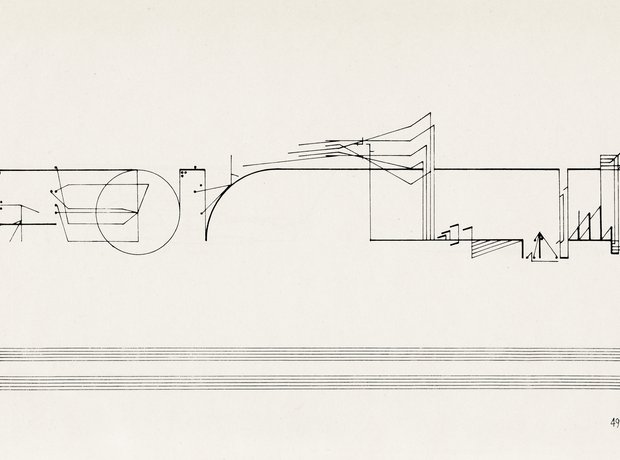
Graphic scores communicate to the musician how they should play a piece by using shape, movements, colour, layout and texture. A graphic score is often laid out like a map rather than the traditional linear score. They are often intended as more of a guide to inspire the musician rather than exact instructions.
One feature of many graphic scores is that they can be played by any number of musicians, on any instrument. Each performance will sound different, with the musician interpreting the score in their own way.
As the 20th century saw developments in electronic music, and opinion broadened on what was classed as music, the idea that musical scores could be more abstract and expressive was more widely accepted.
Graphic scores serve a dual purpose: as well as looking beautiful, they explain abstract ideas about how the music should be played
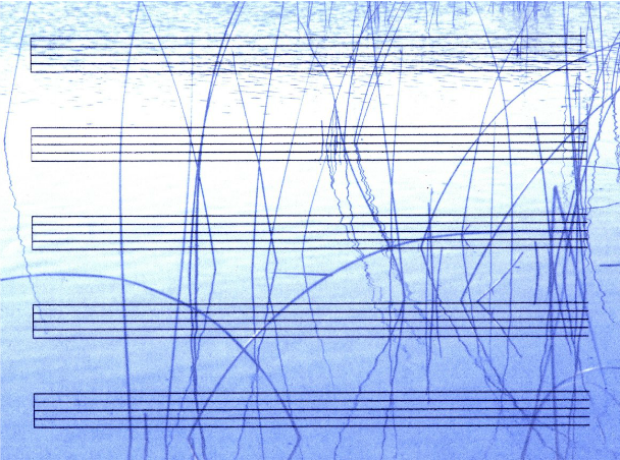
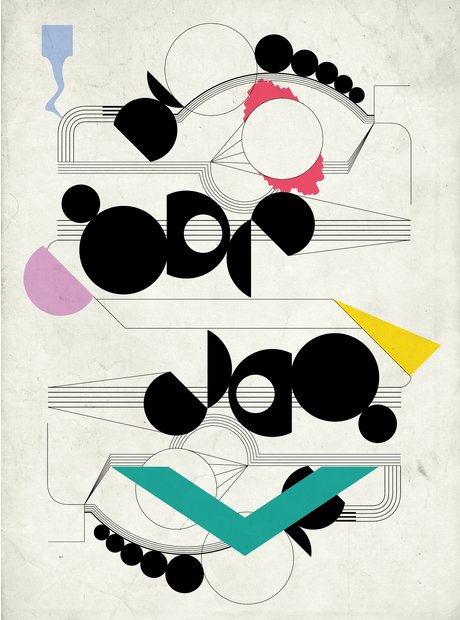
This piece is drawn whilst listening to a piece being played.
Synesthesia is a condition in which one sense (for example, hearing) is simultaneously perceived as if by one or more additional senses such as sight. Another form of synesthesia joins objects such as letters, shapes, numbers or people's names with a sensory perception such as smell, colour or flavour.
https://www.youtube.com/watch?v=obrBAysVef0
This video visually represents what the musician, who has synesthesia, sees when she is playing. The coloured lights brighten and fade depending on the intensity of the sound, and the note being played informs the colour of the light. Note that the musician is playing gentle violin notes, which is reflected by the soft edges of the orbs.


Some people compare the experience of musical synesthesia to the work of Kandinsky
/https://public-media.si-cdn.com/filer/53/e5/53e5475f-2e8f-4fec-b296-17ca53f2cd3c/composition-vii-1913.jpg)
Study task:
My first attempt at a graphic score was to just listen to the music and move my pen freely

But I think this looks pretty boring and amateur.
To me techno sounds really industrial, almost like machines in a factory but with rhythm. A lot of Berlin techno raves were originally in abandoned factories, in big grey brutalist buildings. I used images of some famous brutalist buildings in Berlin along with images of the clubs themselves to create collages which reflect the sound of the music. All of the collages are in black and white because when I listen to techno I don't see any colours inside my head.


This one is a bit different to the others because I created it digitally instead of cutting by hand. Most techno songs have a strong 4x4 beat, which I have represented here in concrete blocks. The weight of the blocks represents the heaviness of the beat. I incorporated a swarm of mosquitos because many techno songs have background elements which fade in and out of audibility, much like the sounds heard when insects are buzzing around you.

'Visualising music' is one approach I could apply to my record sleeve design.
I went to the uni of Leeds campus to look at some of the concrete buildings there, which have a similar brutalist style of architecture to many of the buildings in Berlin.


No comments:
Post a Comment